September
2000 - September 2002
Don Radlauer

An Engineered
Tragedy
Statistical Analysis of Casualties in the
Palestinian - Israeli Conflict
ICT
Associate
Introduction
For the last 23 months, Israel and the Palestinian Arabs have been engaged in a “low-intensity conflict” generally referred to as the “al-Aqsa Intifada”. This conflict has caused over 2,200 deaths so far; and yet, its most significant aspect seems to be the struggle for international public opinion rather than any effort at gaining a conventional military victory. New reports of death and injury appear almost daily in the world’s news media, generally accompanied by the current tally of the total number of people killed on each side. Pundits and laymen read these reports and draw conclusions from the simplistic statistics they convey.
Before many months
of this conflict had passed, it became apparent to
some observers that the “fatality scorecard” commonly included in
coverage
of the al-Aqsa conflict was painting an oversimplified and deceptive
picture
of a complex reality. A more thorough accounting and analysis of the
conflict’s
incidents and casualties should enable a better understanding of the
true
nature of the conflict. Accordingly, the International Policy Institute
for Counter-Terrorism (ICT) launched the Al-Aqsa Casualties Database
Project
to provide such an accounting. (See Project
Summary for a brief review of the project’s findings.)
A Note on Terminology
The word “intifada” is properly translated as “uprising”. The use of either of these terms implies a judgement as to the nature of the conflict – specifically that, like the earlier Intifada of 1987-1991, this “intifada” is a spontaneous and authentic expression of “popular rage at Israeli occupation”. Some supporters of Israel, realizing the political significance of the common, often unthinking use of such terms, have attempted to substitute other names for the conflict, such as “the Oslo War”. None of these alternative names has gained general currency.
As this study aims to investigate the true nature of the ongoing Israeli/Palestinian conflict, it seems most appropriate to avoid the use of all such value-laden terms. Accordingly, we decided to use the more neutral and general term “al-Aqsa conflict” to describe the events which began in September 2000. Even this usage can be criticized, in that it suggests some specific causal connection between the conflict and the al-Aqsa Mosque; but it seems to be a useful compromise.
Another Note: On Reading Graphs
It has been pointed
out that readers of this study may be misled by
the fact that various graphs are shown with differing scales. According
to this critique, some readers may receive a visual impression that
minimizes
Palestinian fatalities relative to Israeli ones. We have made no
attempt
to mislead the reader in this way. If all graphs in this study were
displayed
using a uniform scale, many of them would be difficult or impossible to
interpret; thus we have chosen a scale for each graph that best conveys
the point made by that graph. Lacking a better solution to the
problems
of visually conveying numeric information, we can only ask that the
reader
A) note the numeric scale indicated next to the vertical axis of each
graph;
and B) remember that when we suggest comparisons be made between two
different
graphs, the intended comparison is generally one of “shape” rather than
“size”. In all cases, the accompanying text should clarify any
ambiguities.
Summary of Findings
Our research and analysis shows that the al-Aqsa conflict is different in many respects from what it is generally believed to be. Among our findings are the following:
- The al-Aqsa conflict is not a single, homogenous event. To describe it glibly as “an uprising against Israeli occupation” grossly oversimplifies and distorts our view of the conflict, and obscures much of the significance of its history. The conflict has, in fact, gone through four distinct phases from its beginning until now. Judging by fatality statistics, only the first of these phases, which lasted less than three months, strongly resembled a true “intifada”. The especially high rate of death among the Palestinians during this phase probably created the general public impression of the entire conflict as an overwhelming slaughter of overmatched Palestinians.
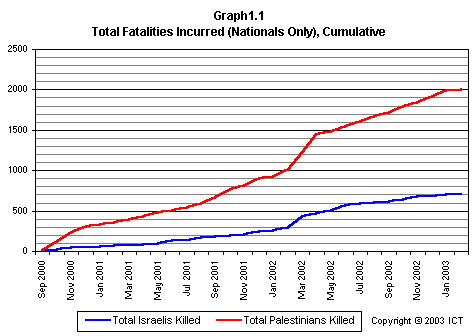
- The usual fatality count quoted in news articles presents an inaccurate and distorted picture of the al-Aqsa conflict, exaggerating Israel’s responsibility for the death of noncombatant civilians. For example, our database shows a total of 603 Israelis killed, compared to 1596 Palestinians, up to 29 August 2002 – numbers in general agreement with media reports (see Graph 1.1).
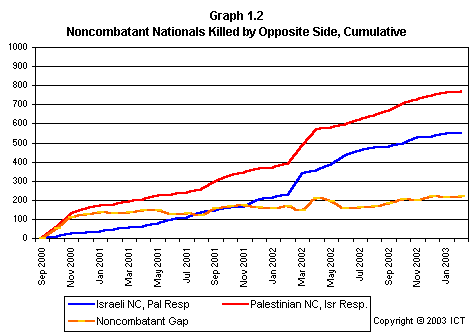
- But such numbers hide as much as they reveal: They lump combatants in with noncombatants, suicide bombers with innocent civilians, and report Palestinian “collaborators” murdered by their own compatriots as if they had been killed by Israel. Correcting for such distortions, we can arrive at a figure of 617 Palestinian noncombatants killed by Israel, compared to 471 Israeli noncombatants killed by Palestinians (see Graph 1.2). While Israelis account for 27 percent of the total fatalities as generally reported, they represent 43 percent of these noncombatant victims. There are a number of valid ways of arriving at such corrected figures to compare the extent to which each side has been responsible for the killing of noncombatants; they all show a much more balanced picture of the conflict than the raw totals do.
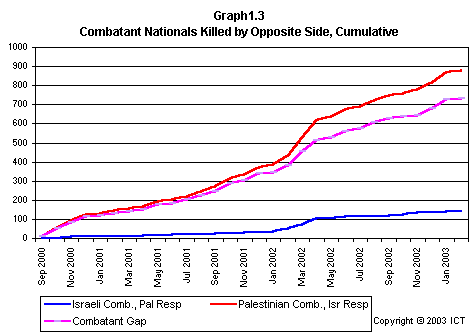
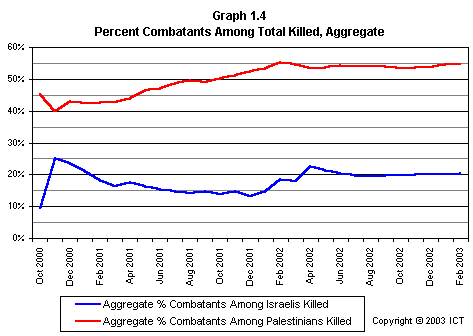
- While Israeli fatalities in the al-Aqsa conflict have consisted of 80 percent noncombatants (and over 80 percent before the substantial IDF casualties suffered during the Jenin incursion of April 2002), Palestinian fatalities have consisted of more combatants than noncombatants (see Graphs 1.3 and 1.4).
Graph 1.2 shows the gradually increasing number of noncombatant fatalities each side has suffered at the other's hands, along with the “noncombatant gap” – the number by which Israeli killing of Palestinian noncombatants exceeds Palestinian killing of Israeli noncombatants. It is worth noting that this “noncombatant gap” rose quickly in the first few months of the conflict, and has remained within a narrow range since then.
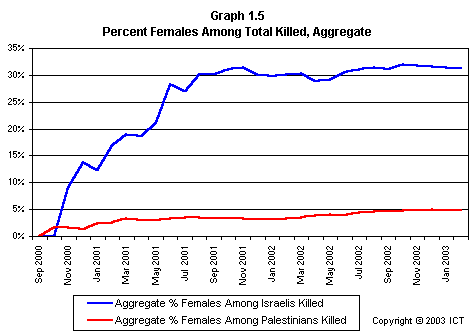
- The proportion of females among Israeli fatalities was relatively low in the early months of the conflict, and gradually rose to a level of around 30 percent; since June 2001, this proportion has remained fairly stable. Palestinian fatalities, in contrast, have been consistently and overwhelmingly (over 95 percent) male (see Graph 1.5).
As Graph 1.3 shows, the “combatant gap” – that is, the “excess” of Palestinian combatants killed by Israel over Israeli combatants killed by Palestinians – has continued to grow over the life of the conflict. Contrast this with the “noncombatant gap” in Graph 1.2.
The proportion of combatants among Palestinians killed has increased significantly over time, from around 40 percent to its current value of 54 percent. (It is also worth noting that the figure for Palestinian noncombatants includes a large number of fatalities for which combatant status could not be determined – see “Combatants and Noncombatants”, below.)
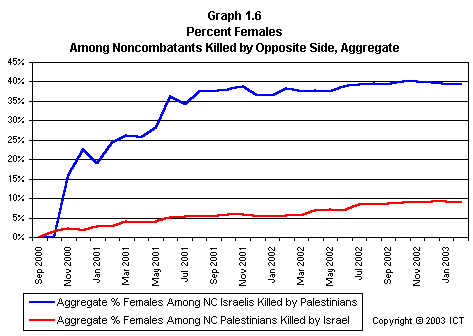
If we restrict our view to each side's noncombatants killed by the opposing side, the gap in the percentage of females among those killed is even wider: 40 percent of Israeli noncombatants killed by Palestinians have been female, compared to 8.4 percent of Palestinian noncombatants killed by Israel (see Graph 1.6). The latter figure represents a slight increase from its previous levels, due to the several women and girls killed in July's Israeli “targeted killing” in Gaza.
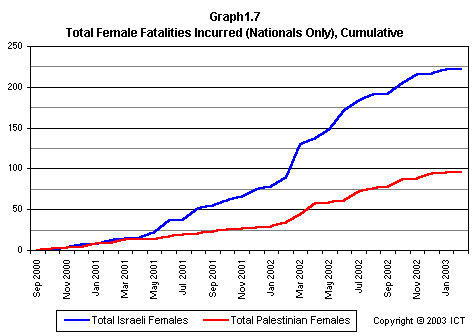
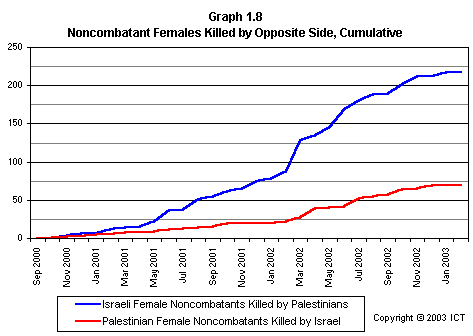
- In absolute terms, many more Israeli females have been killed than Palestinian females. If we include combatants and fatalities for whom responsibility is unclear, 70 Palestinian females have been killed; the corresponding Israeli figure is 190 (see Graph 1.7).
-
Restricting ourselves
to cases where clear responsibility can be reliably
assigned for noncombatant deaths, we see that Israel has been
responsible
for killing 52 Palestinian noncombatant females, while Palestinians
have
killed 187 Israeli noncombatant females – more than three times as many
(see Graph 1.8).
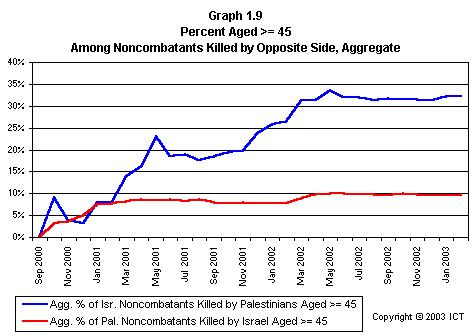
- A much higher proportion of Israeli noncombatants killed by Palestinians have been aged 45 or older than the equivalent proportion among Palestinian noncombatants killed by Israel - over 30% of Israeli noncombatants have been 45 or older, compared with only 10% of Palestinian noncombatants (see Graph 1.9).
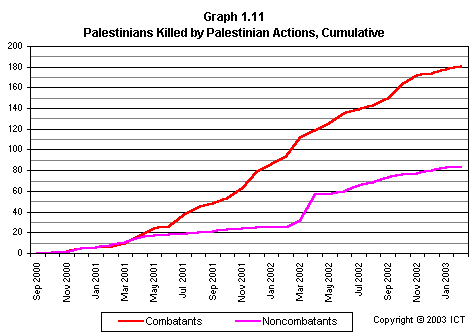
- The number of Palestinians killed by actions of their own side – including suicide bombers, “work accidents”, collaborators, and people killed in intra-Palestinian fighting – has increased strongly over time. So far, over 200 Palestinians have died in this way; they represent more than twelve percent of the total Palestinians killed (see Graph 1.11). (Note that this category does not include Palestinian “suicide shooters” – gunmen who carry out attacks with the expectation that they will be killed by Israelis in the course of their attacks – or other attackers whose foolhardiness might be construed as “suicidal”. Only Palestinians who were killed with no “help” from Israel are included.)
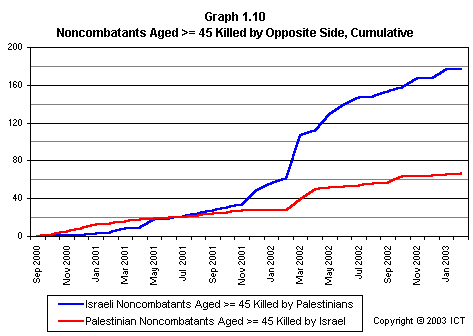
In absolute terms, nearly three times as many Israeli noncombatants aged 45 and over have been killed as Palestinian noncombatants 45 and over (see Graph 1.10). Israelis have killed 55 noncombatant “mature” Palestinians, while Palestinians have killed 148 “mature” Israeli noncombatants.
- The second phase of the al-Aqsa conflict lasted for nine months; this phase was characterized by a rough parity in each side’s killing of the other side’s noncombatants. The third phase saw a higher (and more erratic) level of violence than the second phase; even so, noncombatant fatalities in the third phase were much more balanced between Israelis and Palestinians than they were in the first phase. The fourth phase appears to be characterized by a lower level of fatalities than has been seen for some time, with fewer successful large-scale terrorist attacks. The demographic composition of Palestinian noncombatants killed in the fourth phase is quite different from that of previous phases.
- Palestinian fatalities, including those of noncombatants, have shown extremely regular age distributions. In combination with the fact that almost all Palestinians killed in this conflict have been male – and absent any other reasonable explanation for such a non-random pattern of fatalities – this suggests that large numbers of Palestinian men and teenaged boys made a choice to confront Israeli forces, even after many of their compatriots had been killed in such confrontations. The overall pattern of Palestinian deaths is completely inconsistent with accusations that most of these fatalities resulted from random Israeli attacks on residential areas, mixed-sex crowds at roadblocks, or other ordinary civilian gatherings.
- Israeli fatalities do not show such a high regularity in their age or gender distribution. Population segments like women or older people would not normally be specifically targeted for their military importance; thus their higher relative prevalence among Israeli fatalities is an indication of the degree to which these deaths were caused by random attacks on a civilian population.
Data Gathering
The greatest care and effort in carrying out this project has been spent in gathering and evaluating enough information on each fatal incident to enable accurate classification of each claimed fatality. Reliable and detailed data on Israeli casualties of the al-Aqsa conflict has been relatively easy to find, as this information is extensively reported in Israeli and foreign newspapers, as well as various official and unofficial websites. Palestinian Arab fatalities present much greater difficulty, for several reasons:
- Arab names are often long and complex; in many cases different sources give different casualty names for the same incident, and it is difficult to ascertain whether the different names in fact refer to the same person.
- Detailed reports of Palestinian casualties are generally provided by Palestinian organizations and individuals; in some cases these reports are “slanted” or even fraudulent, due to pressures to paint Israel in as negative a light as possible.
- The Israel Defense Forces do not keep a precise record (or at least have not so far provided such a record to us) of every time, place, and circumstance where weapons have been used; thus, certain Palestinian reports of fatalities due to Israeli fire cannot be confirmed or refuted. In many cases, we have given the Palestinian account of events the benefit of the doubt, even though the casualties may have resulted from Palestinian actions, rather than Israeli actions. In cases where the cause of death as reported by Palestinian sources is very much open to question, we have assigned a Low confidence Level to that particular casualty.
Categorization
In order to provide a better understanding of the nature and significance of al-Aqsa conflict incidents and casualties, we have classified them according to several criteria. This classification system is a reflection of our desire to improve upon the usual reportage, which – to give an extreme example – treats the death of a suicide bomber as equivalent to the death of one of his victims. A good system of classification, combined with carefully-gathered data, provides rich opportunities for analysis.
As the conclusions reached in this study are strongly influenced by the categories we have chosen for our analysis, it is important to understand these categories in some detail.
| Incident Organization |
This
category is used to classify incidents,
such as terror attacks, which can be attributed to a particular
terrorist
organization; it is used as well to identify the groups targeted by
Israeli
“targeted killings”.
|
| Incident Type |
This
category provides a broad description of
the type of incident that occurred; examples include “Terror Attack”,
“Roadblock
Confrontation”, and so on.
|
| Attack Type |
This
is a more specific category, identifying
the particular form of violence which led to injury or loss of life.
Examples
include “Car Bomb”, “Suicide Bomb”, and “Lynching”.
|
| Incident Target |
The
Incident Target represents the immediate
goal of an attack, as opposed to any broader political aims. Examples
include
“Civilian”, “Vehicle”, “Hotel”, and “Militant”.
|
| Incident Confidence Level |
This
category reflects our considered opinion
as to the reliability of a report. Confidence Level as applied to
incidents
represents the degree of certitude that the incident itself took place;
applied to individual casualties, it represents the level of certainty
that a particular individual was injured or killed in the incident. It
is possible that an incident itself may have a high Confidence Level
while
some of the casualties attributed to the incident have a lower
Confidence
Level. This is the case where the incident itself was well attested,
but
some of the reports of casualties attributed to the incident were less
reliable.
Confidence levels are as follows:
|
| Side Responsible for Incident |
This
category assigns responsibility for initiating
an incident – for example, “Israel,” “Palestinians,” “Probably Israel,”
“Probably Palestinians,” or “Unclear.” In the case of a terrorist
attack
on Israeli civilians by Palestinians, the Side Responsible is
listed
as “Palestinians”. The same is true of “work accidents.” In the case of
a targeted killing of a Palestinian militant carried out by Israel, the
Side
Responsible is listed as “Israel.” In the majority of
incidents—Roadblock
Confrontations, Violent Clashes, etc—the Side Responsible is
listed
as “Unclear.”
Note that Side Responsible in this study refers to physical responsibility only, and does not indicate a moral judgement. |
| Side Responsible for Casualty |
In
the majority of incidents, assigning responsibility
for an incident to one side or another is insufficient for purposes of
analysis. An incident may be initiated by Palestinians—for instance, an
armed attack by Hamas militants on an Israeli bus—but end with the
militants
being killed by Israelis. In such a case, the Side Responsible for
Incident
would be “Palestinians”, while the Side Responsible for Casualty
would be “Israel” in the case of each militant, and “Palestinians” in
the
case of each Israeli casualty. There are also cases in which
Palestinians
killed Palestinians and Israelis killed Israelis.
As with Side Responsible for Incident, Side Responsible for Casualty represents only the physical responsibility for causing death or injury, and expresses no judgement as to the appropriateness of that action. |
| Combatant Level |
This
is one of our most significant ways of
classifying casualties, and represents the degree to which someone
killed
or injured during the course of the al-Aqsa conflict can be considered
an “innocent victim”. Our decisions in defining the Combatant Level
categories
and assigning casualties to these categories are made with reference to
ICT’s published definition of terrorism, explained in Boaz Ganor’s
article,
“Terrorism: No Prohibition Without Definition”.
The status of “probable combatant” has also been assigned to people who knowingly took some action which would lead to increased danger, such as entering an area in which fighting was going on or which security officials had declared off-limits.
Mere possession of a weapon does not imply combatant status. A civilian driving with a weapon in his/her car, or a pedestrian with a holstered pistol, is normally considered a noncombatant. However, a civilian who encounters a terror attack in progress and draws his/her weapon in an attempt to stop or prevent the attack is a combatant once the weapon is out of its holster.
|
| Casualty Confidence Level |
This
category reflects our considered opinion
as to the reliability of a report of an individual death. A Confidence
Level is applied to individual casualties as well as to incidents
because
we found that in many cases an incident itself was well attested, but
some
of the reports of casualties attributed to the incident were less
reliable.
Confidence levels are as follows: Low Questionable High Extremely High |
| Age |
Where
known, the age of the casualty is entered
into the database. There are a number of casualties, particularly on
the
Palestinian side, where the age is unknown, or uncertain.
|
| Gender |
The
gender of casualties has turned out to be
central to our analysis, as discussed below.
|
| Nationality and Secondary Nationality |
The
casualty’s nationality is obviously at the
heart of any comparison of casualties between the two sides. In some
cases,
the casualty had dual citizenship. For this reason, we’ve included a
field
for Secondary Nationality.
|
| Residence |
This
category was added in order to serve as
a basis for a geographical analysis of both casualties and incidents.
|
| Casualty Type |
Casualty
Type describes whether the casualty
was killed or injured, and if the latter, the extent of the injury. The
Casualty Types are:
Injured Moderately Injured Seriously Injured Unclear Killed |
| Organizational Affiliation |
This
category describes the casualty’s membership
in an existing non-governmental organization. This is particularly
useful
in the case of Palestinian combatant fatalities, who were largely
active
members of known terrorist groups, rather than individuals acting on
their
own.
|
A note on “Combatants” and “Civilians”
Media reports frequently discuss the fatalities of the al-Aqsa conflict in terms of the number of “civilian fatalities” on each side. We have deliberately avoided this usage. In any conflict between a country with conventionally-organized military and police forces and an opposing force mostly composed of non-uniformed “irregulars”, the uniformed forces cannot avoid killing a disproportionate number of “civilians” – since even their most deadly opponents are usually not members of an official military, and in many cases have perfectly respectable “day jobs”.
In the current Israeli-Palestinian conflict, the distinction between Palestinian “civilians” and members of the plethora of official Palestinian Authority security forces is even harder to make, since many Palestinian policemen (and members of the other P.A. uniformed forces) combine their official service with membership in one or more unofficial groups such as Hamas or the various arms of Fatah. When Palestinians in this situation have killed Israeli noncombatants, they have generally done so in their “civilian” capacity.
At first glance, it should be easier to determine which Israeli fatalities are “civilians”. However, even here the distinction between “civilians” and members of official security forces paints a somewhat distorted picture. A substantial number of Israeli fatalities, especially those killed inside “Israel proper”, have been members of the civil police, or noncombatant members of the Israel Defense Forces – such as office workers and mechanics.
As a result of all these factors, dividing this conflict's fatalities into “civilians” and “non-civilians” over-emphasizes the “civilian” status of many of the Palestinian victims, and to a degree distorts the significance of Israeli fatalities as well. At best, such categorization paints an inaccurate picture of the conflict; and in some instances, those who use these categories are clearly being disingenuous. (As an extreme example, one report in a Saudi newspaper contrasted some 1,400 Palestinian “civilians” killed with about 530 Israeli “soldiers and settlers”.)
For this reason, we
chose to classify those killed by their actual combatant
status, according to the criteria laid out in the “Combatant Level”
section
above. While this method requires a degree of judgement in categorizing
those killed, it offers some hope of making sense of an assymmetrical
conflict;
whereas the alternative system, while easier to apply, cannot provide
meaningful
results.
Results and Trends
1. General Trends in Overall Fatalities
The first impression conveyed by the standard “Intifada body count” report is that people on both sides of the conflict have been getting killed at a more or less steady pace, with Palestinian fatalities outnumbering Israeli fatalities by a factor of almost three to one. A glance at Graphs 2.1 and 2.2 quickly dispels this illusion.
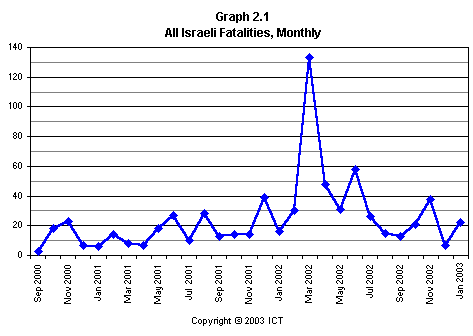
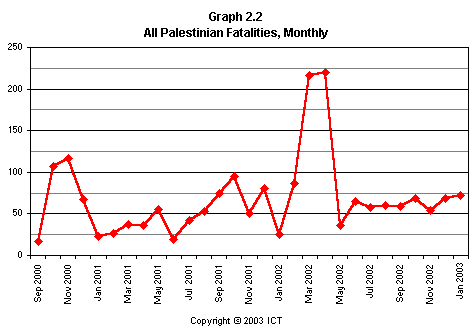
These graphs display all Israeli and Palestinian fatalities month-by-month, with no categorization or qualification. They show that Israeli casualties have varied widely from one month to the next, but have shown a general upward trend. (This trend is somewhat masked by the especially high death toll of March 2002, which “flattens” the rest of the graph.) Palestinian fatalities, on the other hand, were very high for the first few months of the conflict, then remained at a lower level – although still generally above the level of Israeli casualties. They increased again starting in September 2001 – possibly as a result of new, more aggressive Israeli counter-terrorism tactics adopted after the September 11 terror attacks on the United States. Large numbers of Palestinians were killed in March and April 2002, in the course of Israel’s “Operation Protective Shield” incursions into Palestinian-Authority-ruled cities; this operation was a response to a rash of major Palestinian terror attacks.
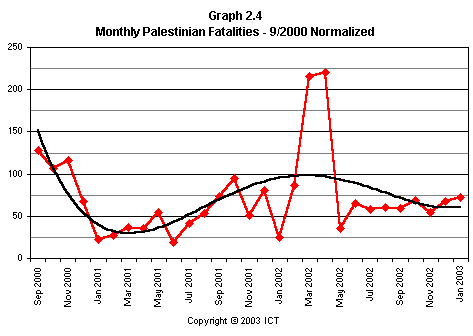
In order to show these trends more clearly, it is helpful to correct (or “normalize”) for the fact that the al-Aqsa conflict began on 27 September 2000* – so that the first “month” shown on our graphs is in fact only four days long. By multiplying by 30/4, we can correctly display a value corresponding to the rate at which people were being killed during these first four days. Graphs 2.3 and 2.4 show this correction, as well as trend-lines to clarify the changes in the rates of death.
* Note that we consider the beginning of the “al-Aqsa Intifada” to have been on 27 September 2000, the date of the first Palestinian attack on Israelis carried out by official Palestinian Authority personnel.
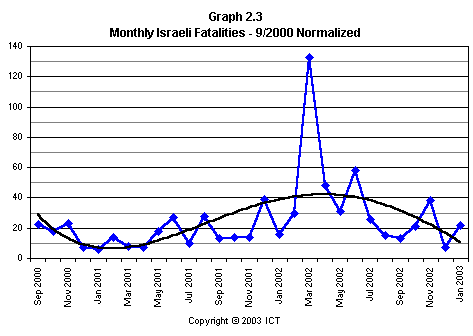
While the monthly number of Israeli fatalities is rather chaotic, there has clearly been an upward trend in the fatalities during both “good” and “bad” months (that is, higher peaks and higher troughs in the graph), especially since December 2000 – January 2001. Palestinian fatalities, on the other hand, trended downward from a very high beginning, then picked up somewhat from September 2001 onwards – although they did not approach the levels of the first months of the conflict until March 2002.
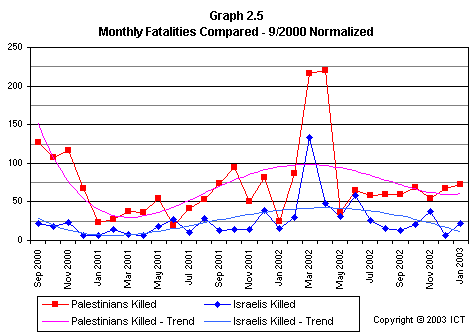
Graph 2.5 compares these overall trends in fatalities suffered by the two sides. While it is evident that the overall level of Israeli fatalities has been consistently lower than that of Palestinian fatalities, the gap between the trend-lines lessened over the first few months of the al-Aqsa conflict and then remained roughly steady until September 2001. Since then, the gap between fatalities incurred by the two sides has been fluctuating erratically.
2. Refining the Trends – Responsibility and Combatant Status
So far we have looked only at overall fatality figures, without regard to any difference between one fatality and another. There are several ways in which we can refine our view. One obvious approach is to classify fatalities by which side caused them, rather than by the nationality of the deceased. By counting the people killed by the actions of each side rather than simply those who died on each side, we now classify suicide bombers and people killed while preparing explosives (“work accidents”) as part of their own side’s tally of deaths, rather than as apparent victims of the other side. (Killings of foreign nationals are also included in this classification; almost all of these have been foreigners working in Israel who were killed by Palestinian terrorist attacks.) Graph 2.6 shows the trends in deaths caused by each side, ignoring cases in which responsibility for death was unclear.
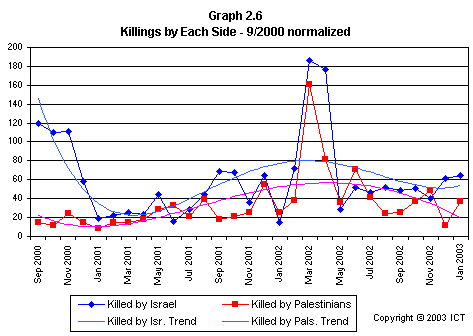
While the general appearance of this graph is similar to what we have seen before, it is significant that when we make these adjustments, the figures for fatalities caused by each side were actually quite similar, on average, for all but a few months after January 2001. (Note that, as mentioned above, selecting fatalities by the side “responsible” for them does not imply that the responsible side is at fault; “responsible” in this context refers only to physical rather than moral responsibility.)
Our view can be refined still further (in the sense of selecting those deaths which are “politically significant”) by ignoring the deaths of combatants. This eliminates from consideration those killed who were actively involved in the fighting, and thus legitimate targets for attack: soldiers at their posts, active members of terrorist groups, suicide bombers, and so on. Those remaining – even though many of them, such as stone-throwing protestors, may have knowingly put themselves in harm’s way – are considered “noncombatants”. (Note that for our purposes, “Violent Protestors”, “Probable Combatants”, and “Full Combatants” are treated as combatants; all other classifications, including “Unknowns”, are considered noncombatants.)
Noncombatant status is significant in several ways:
- Attacks by non-governmental groups on noncombatants are categorized as terrorism, as opposed to attacks on combatants, which are categorized as guerilla warfare – a more legitimate form of “resistance to occupation”.
- Large numbers of noncombatant fatalities inflicted by Israeli forces are a possible sign of problems in field tactics, as noncombatants are not normally considered to present an immediate danger to soldiers on duty. (One of the few precepts accepted by both Israelis and Arabs, along with outside observers of the conflict, is that Israel has a moral responsibility not to kill Palestinian noncombatants.)
- Noncombatant deaths are normally considered more deserving of sympathy, and thus have a special significance in a conflict being fought as much in the news media as on the ground.
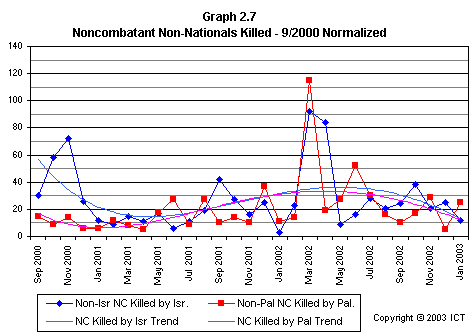
Graph 2.7 shows the trends in noncombatant deaths inflicted by each side on "non-nationals" – i.e. citizens of the opposing side and third-country citizens. This graph shows the same general trends as Graph 2.6, although (as Palestinian combatant fatalities are no longer included) the vertical scale is somewhat lower. Also, this graph shows even more clearly the trend for a rough parity between the two sides after December 2000.
3. Identifying Phases of the Conflict
Graphs 2.5, 2.6, and 2.7 suggest that the al-Aqsa conflict, up to late July 2002, can be divided into four phases:
- An initial phase characterized by very high Palestinian fatalities and relatively low Israeli fatalities;
- A second phase of near-parity between the two sides (when we adjust for either combatant status or responsibility);
- A third phase in which fatalities on both sides fluctuated rather wildly.
- A fourth phase, begun in late June 2002, in which the overall level of killing on both sides appears to be declining somewhat. It is still too early to be absolutely certain that this is a genuinely new phase of the conflict, rather than merely another of the several relatively quiet periods that punctuated Phase 3; but after two months, the fourth phase does seem to have established its own identity.
The first phase of the al-Aqsa conflict began on 27 September 2000, and ended in late December 2000. At that time Palestinian fatalities tapered off sharply, and remained generally lower until the next September. December 21, 2000 has been chosen as the last day of this first phase. As a first approximation, we can label this phase of the conflict the “real or apparent popular uprising” phase (leaving room for uncertainty as to whether this “uprising” was genuinely spontaneous, or was manufactured by Palestinian leaders), as most of the fatalities appear to have occurred as the result of Palestinian mass demonstrations or riots, and the Israeli response to them. (A more detailed breakdown of these fatalities by Incident Type remains to be done.)
The second phase began on 22 December 2000, and lasted until September 2001. It was characterized by rough parity between the two sides when fatalities are measured either by responsibility or by noncombatant status. It also featured a general rising trend in Israeli fatalities, as well as in deaths to both sides caused by Palestinians. A final date of 11 September 2001 has been chosen for this period, because changes in Israeli policy and tactics resulting from that day’s terror attacks on the United States appear to have ushered in the next phase.
The third phase of the al-Aqsa conflict began on 12 September 2001 – again, a date chosen somewhat arbitrarily, as the first day “post 9/11”. This phase began with a significant increase in Palestinian fatalities, in contrast to the preceding period of rough parity between the two sides in noncombatant fatalities suffered and fatalities caused. Over the course of this phase, fatalities on both sides fluctuated dramatically from month to month, with Palestinian and Israeli trends rather closely correlated. The nine months of this phase saw attempts to impose cease-fires, which sometimes resulted in brief periods of relative quiet; visits to the region by foreign “peace envoys”, which often resulted in flare-ups of violence; and Israeli incursions into Palestinian Authority-controlled territory, which caused temporary reductions in successful terrorist attacks but achieved no long-term results.
The fourth phase of the conflict began with Israel's longer-term re-occupation of major Palestinian towns in the West Bank, around 21 June 2002. Two months into this phase, it appears that the Israeli presence in and around Palestinian towns is reducing the level of success in carrying out terror attacks against Israelis, if not the Palestinians' motivation to do so.
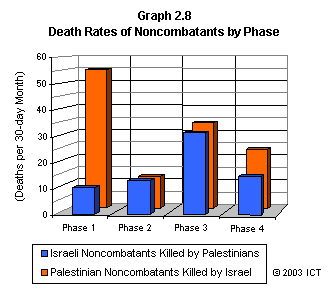
Graph 2.8 displays the overall rates of noncombatant deaths inflicted on each side by the other. It is very clear that since the end of Phase 1 of the conflict, Israeli and Palestinian noncombatant death rates have been almost identical.
More work remains to be done in order to match the trends of fatalities with corresponding developments on the political scene. However, one can already point to several significant points: for example, a dip in Israeli fatalities in July 2001 (as a result of international pressure on the Palestinians after the June 2001 Dolphinarium attack); and sharp dips in both Palestinian and Israeli casualties in January 2002. The latter decrease in casualties corresponds to Yasser Arafat’s “cease-fire calls” to his own side on 16 December 2001.
Further sections
will explore other aspects of the phases of the al-Aqsa
conflict in more detail.
4. Combatants and Noncombatants
As noted above, the classification of victims into combatants and noncombatants is important in evaluating both their tactical and political significance. It is worthwhile to examine this classification in more detail.
Graphs 2.9 shows the
distribution of Palestinian fatalities among Combatant
Level categories.
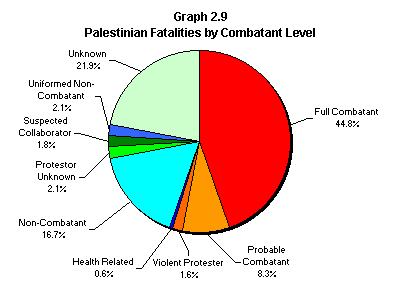
Note that a
substantial portion – almost 55 per cent – of Palestinian
fatalities are either Full Combatants, Probable Combatants, or Violent
Protestors. Of the remaining fatalities, a substantial slice are
classified
as “Unknown”, meaning that their Combatant Level has not yet been
determined.
Ongoing review of existing reports, as well as addition data to be
gathered,
will, we hope, reduce the number of Unknowns.
Graph 2.10 shows the equivalent distribution for Israeli fatalities. The most obvious feature of this graph is the overwhelming preponderance of noncombatants over combatants. According to our practice of classifying only Full Combatants, Probable Combatants, and Violent Protestors as combatants, about one in five Israeli fatalities have been combatants. Even were we to include such categories as civil police and soldiers aboard civilian buses (i.e. Uniformed Noncombatants) among combatants, some 70 per cent of Israelis killed have been noncombatants.
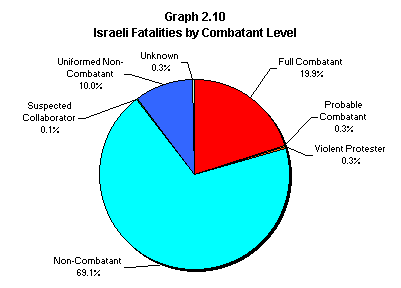
The apparent reason
for the lopsided distribution of Israeli fatalities
is that Israeli combatants are members of a well-trained and equipped
modern
army – and more specifically, one that goes to unusual lengths to
minimize
its casualties. This has two implications: first, that Palestinians
will
generally prefer to attack civilian targets, or alternatively members
of
the military who are not on active duty; and second, that most
Palestinian
attacks on Israeli military patrols or outposts are unlikely to cause
extensive
Israeli fatalities.
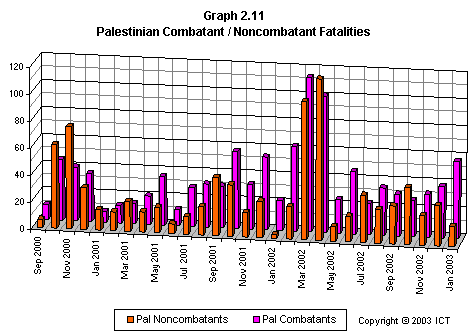
Graph 2.11 shows trends in the balance of Palestinian fatalities between combatants and noncombatants, month by month. Note that Phase 1 and the first month of Phase 3 are both characterized by surges in noncombatant deaths, while most other periods show either parity between combatants and noncombatants, or else a preponderance of combatant deaths.
Graph 2.12 shows the trend in Palestinian fatalities caused by Palestinian actions – including suicide bombings, “work accidents”, internecine struggles, and so on.
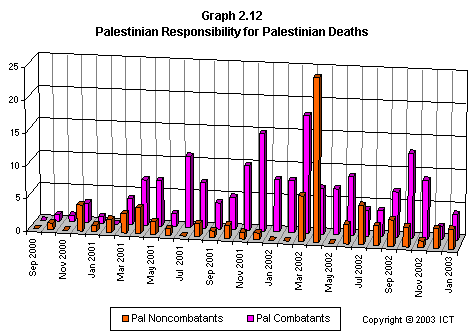
The strong upward trend in Palestinian fatalities due to Palestinian actions suggests several possible explanations: increased suicide bombings, occasional clashes brought on by efforts by Palestinian Authority security forces to exert its authority over the various Islamist groups, and a general breakdown in law and order in Palestinian areas. The large “spike” in Palestinian noncombatants killed by Palestinians in April 2002 appears to represent the large number of “collaborators” killed in the aftermath to Israel’s “Defensive Shield” operation.
Graph 2.13 is the Israeli equivalent to Graph 2.11, showing Israeli combatant versus noncombatant fatalities.
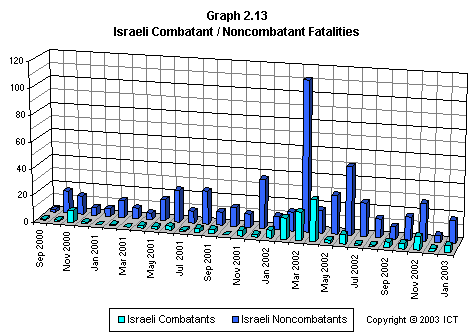
The preponderance of noncombatant over combatant casualties is immediately obvious. The irregular but generally increasing trend in Israeli noncombatant fatalities is also apparent, along with the gradual increase in Israeli combatant fatalities since the beginning of 2002, leading up to the substantial losses suffered during Operation Protective Shield. (Note also December 2001, which included several major Palestinian terrorist attacks perpetrated during American envoy Anthony Zinni’s visit to the area.) As we saw above, the extremely high number of Israeli noncombatants killed in March 2002 "flattens" the rest of the graph, making the overall increasing trend appear less significant than it otherwise would.
Finally, Graph 2.14 analyzes the relationship between each month's Palestinian combatant and noncombatant fatalities over time. (Compare this to Graph 1.4, which shows the cumulative trend rather than each month's ratio individually.)
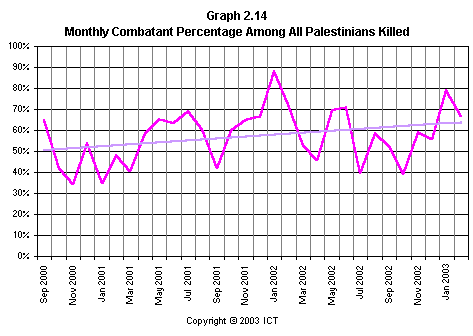
The pronounced increase over time in the percentage of combatants among Palestinian fatalities appears to result from a combination of several possible factors:
- more efficient Israeli tactics which cause fewer noncombatant fatalities;
- an increase in the number of Palestinian combatants killed due to the actions of their own side, or killed by Israeli actions;
- possible changes in the behavior of Palestinian protestors, resulting in fewer and/or less violent demonstrations.
5. Gender War
The issue of gender has not been widely discussed in relation to the al-Aqsa conflict. Investigation of the sexual composition of fatalities on both sides of the al-Aqsa conflict reveals some striking facts.
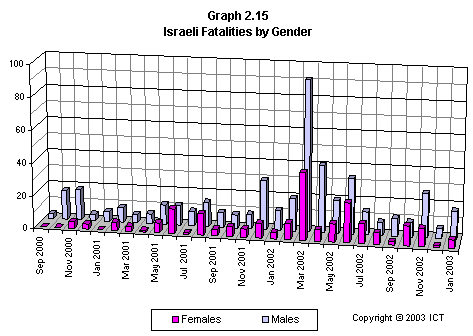
Graph 2.15 shows Israeli fatalities month by month, with male victims separated from female victims. While there is an overall preponderance of male Israelis killed (slightly over two thirds of the victims were male), the pattern is not consistent – there were some months when females outnumbered males among the victims – or extreme. As will be seen below in the section dealing with Age Distribution, the “excess” of males is not consistent across ages; fatalities among young people and the elderly are evenly balanced between the sexes.
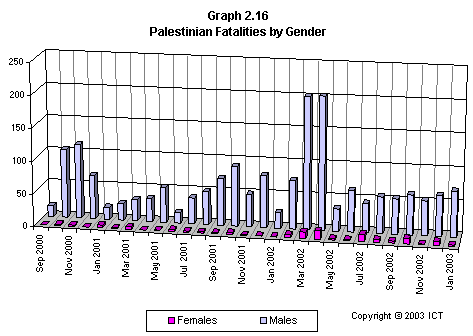
Graph 2.16, displaying the equivalent data for Palestinians, shows a dramatically different picture. Palestinian fatalities in this conflict have been consistently and overwhelmingly male. In total, Palestinian women account for fewer than five percent of all Palestinians killed.
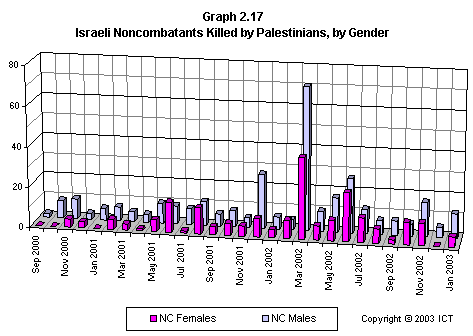
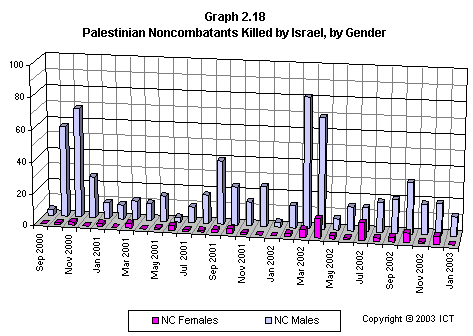
To eliminate any possible distortion caused by including combatants – almost all of them male, on both sides of the conflict – in our picture, we can generate similar graphs illustrating the proportion of males and females among the noncombatants on each side who were killed by the other side. Graphs 2.17 and 2.18 show that even when we restrict ourselves to the noncombatant victims of the conflict, almost all the Palestinians killed have been male.
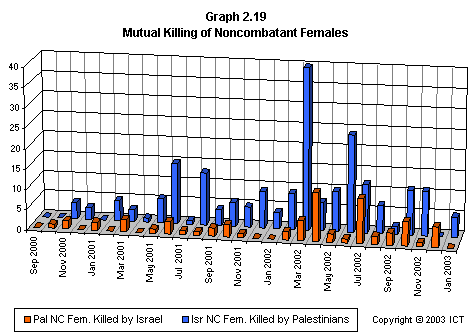
Graph 2.19 reveals a related fact that has received scant media attention: If we look only at females killed, Israeli fatalities have far outnumbered Palestinian fatalities. This graph includes only each side's noncombatant females killed by the opposite side; but even if we include Palestinian combatant females and others whose death is not reliably attributable to Israeli actions, the ratio of Israeli females killed to Palestinian females killed is 2.7 to 1. (Using the more stringent criteria of noncombatants killed by the opposite side, the ratio is 3.6 to one.)
6. Age Distributions
Yet another area that has received inadequate attention is the age distribution of victims of the al-Aqsa conflict. Again, analysis of the data yields some surprises.
Graph 2.20 shows the age distribution of Palestinian female noncombatants killed by Israel. Note that this graph displays no strong trend – the distribution of deaths across age categories appears essentially random.
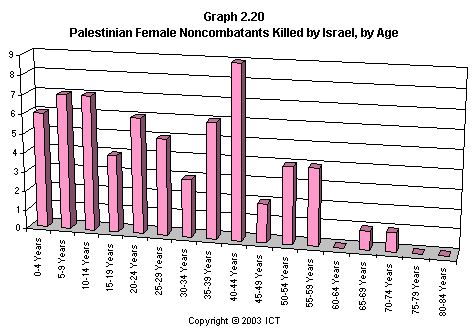
This graph is
included mainly to provide a contrast to those that follow.
Graph 2.21, on the other hand, showing Palestinian noncombatant fatalities of both sexes (which, as we’ve seen before, consist almost entirely of males), displays a highly non-random age distribution.
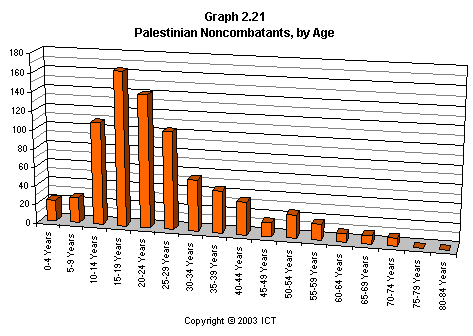
The median age for Palestinian victims is roughly 23; some 37% of them were under twenty years old, and 72% under thirty. The most striking features of the graph, however, are the dramatically high number of teenage noncombatants killed, and the almost perfect “textbook” skewed distribution.
Graph 2.22 shows the age distribution of Palestinian combatant fatalities. Again, this graph shows a highly non-random distribution – but with significant differences from Graph 2.21. Palestinian combatant deaths are even more concentrated in a small age-range than Palestinian noncombatant deaths are, and combatants on average were somewhat older than noncombatants.
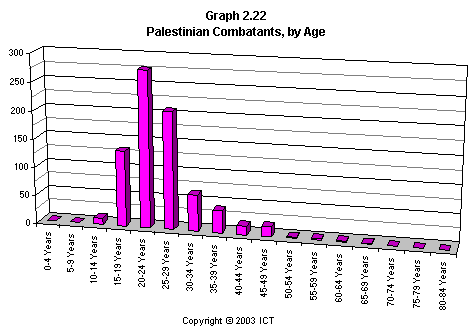
Teenagers are much less prevalent among Palestinian combatant fatalities than among noncombatants; only around 18% of all Palestinian combatants killed were under twenty years old. (This reflects, to a minor degree, the fact that as a matter of principle we have classified essentially all Palestinians under the age of 13 as non-combatants.) The median age for Palestinian combatants is about 24 years. On the other hand, around 80% of the Palestinian combatants killed were under thirty – a slightly higher percentage of under-age-thirty deaths than among Palestinian noncombatants.
The distribution of Palestinian fatalities across age and gender demonstrates a simple but important fact: Palestinians killed in the al-Aqsa conflict have been overwhelmingly male, and for the most part teenaged or in their twenties. (Note, though, that the number of children killed under the age of ten is very low – under five percent of noncombatants.) This is highly significant, as it is very different from the results one would expect from random Israeli fire into inhabited neighborhoods, or other forms of indiscriminate killing of which Israel has been accused.
These graphs suggest that even the noncombatants among the Palestinians killed in this conflict were not, for the most part, passive victims of Israeli aggression. It appears that there was a strong element of self-selection among those who would eventually be killed – in short, teenagers and young men decided, or were encouraged, to confront Israeli forces and, all too often, “achieve martyrdom”. In this context, it is unsurprising that this element of self-selection – showing up as a more “focused” distribution – is even stronger for Palestinian combatants.
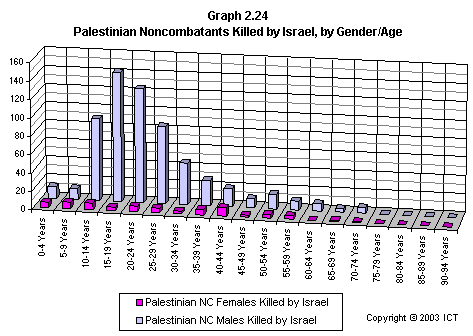
Graph 2.23 and 2.24 provide separate age breakdowns for males and females, for Israeli noncombatants killed by Palestinians, and Palestinian noncombatants killed by Israel. The Israeli fatalities, both male and female, display patterns consistent with a population subject to terror attack – an essentially random distribution, with a slight prevalence of males among ages when adults are more likely to be “out and about”. (It is interesting to note that female deaths are roughly equal to male deaths for ages below 20 and above 59; the lower number of female deaths between the ages of 20 and 59 presumably reflects more time spent indoors.)
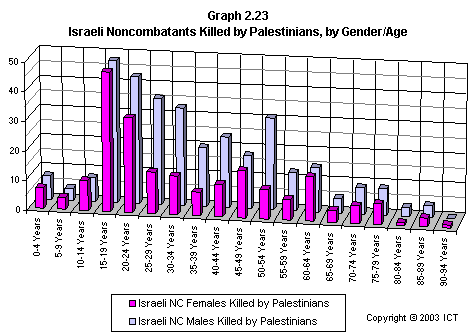
The Palestinian pattern is very different. Palestinian female noncombatants (as more easily seen in Graph 2.20, above) show a fairly random age distribution; but Palestinian male noncombatants display an age distribution completely unlike that of any of the other noncombatant groups. It is apparent from these graphs that the Israeli killing of Palestinian noncombatant males is a very different phenomenon from the killing of other noncombatants in this conflict.
Graph 2.25 shows another interesting aspect of the age distribution of Palestinian fatalities. Here noncombatant Palestinians killed by Israel have been divided up according to the al-Aqsa conflict phases described above.
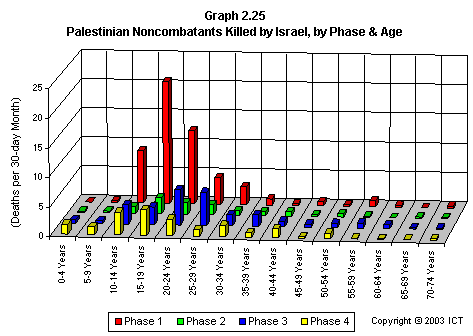
In order to make accurate comparisons among phases of different lengths, the data has been “normalized” into deaths per 30-day month. When the data is graphed in this way, several things become apparent:
- Each phase of the conflict shows a distinct difference in the overall rate at which noncombatants were killed. This is most obvious in the case of Phase 1, during which many noncombatants were killed over a relatively short time-span. Phase 2 shows a dramatic 75% reduction in the rate at which Palestinian noncombatants were killed. Phase 3 displays a rate of noncombatant death more than twice that of Phase 2, but still substantially less than that of Phase 1. (Note that this graph somewhat understates Phase 3 deaths, as we don't yet know the ages of some 63 of the Palestinian noncombatants killed by Israel during this phase – 20% of the total for this phase. Compare with Graph 2.8, which includes noncombatants whose age is unknown.) The overall rate of death of Palestinian noncombatants has declined somewhat in Phase 4.
- While Phase 2 saw a major reduction in the rate of noncombatant death, the age distribution of noncombatant fatalities was similar to that during Phase 1. This implies that a substantial proportion of the noncombatants killed in Phase 2 were probably killed in circumstances similar to those in Phase 1 – that is, with the same self-selection process among potential victims.
- Phase 3 displays a significantly different pattern. While Phase 1 noncombatant deaths show a strong peak in the teenage years (with a median age at death of around 18-19), Phase 3 noncombatants killed were, on average, significantly older. The greatest number of deaths occurred between the ages of 20 and 29, and the median age of death was around 25.
- The pattern of noncombatant Palestinian fatalities in Phase 4 appears much more random than the pattern for earlier phases. For the first time, a large proportion of those killed have been babies and young children. Most of this increase in death among the very young can be attributed to a single incident: Israel's July 2002 “targeted killing” in Gaza.
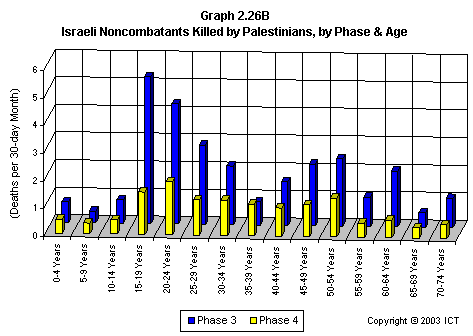
Graphs 2.26A and 2.26B show total Israeli noncombatant fatalities for each phase of the al-Aqsa conflict. (Two separate graphs are shown here for readability; combining them as was done to create Graph 2.24 resulted in a graph that was colorful but extremely difficult to interpret.)
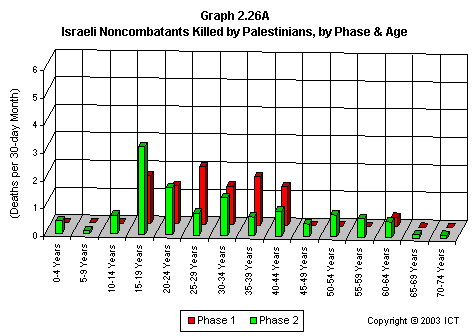
Four facts are immediately apparent:
- Phase 1 shows almost all casualties (the sole exception is one person aged between 60 and 64) between 15 and 44 years old. The fact that almost all Phase 1 Israeli deaths took place within these ages – a very different pattern than is seen for later phases of the conflict – suggests that the incidents resulting in these fatalities were different from those that came later. (This should be clarified by future analysis of fatalities by Incident Type.)
- Phases 2 and 3 show that Israeli teenagers were killed more than any other age bracket. This high number of teenaged fatalities may be the result of suicide bombings, many of which targeted groups of young people. Again, it is hoped that analysis by Incident Type will clarify this issue.
- Phases 2 and 3 show a considerable number of fatalities among people aged 40 and over. The general pattern of death among Israeli noncombatants appears to be much more random than what was seen for Palestinian noncombatants. This suggests that selection of victims by their own side, which appears to account for the age distribution of Palestinian fatalities, is not a factor in Israeli noncombatant fatalities. Once more, this is an area for further investigation.
- The rate of Israeli fatalities increased from phase to phase, until the re-occupation of Palestinian cities at the beginning of Phase 4. The age distribution of Israeli fatalities has become broader over time as well.
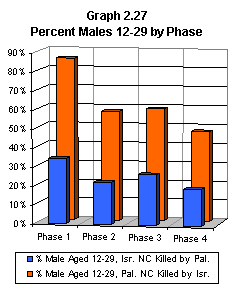
One frequently-used measure of the extent to which noncombatant fatalities represent “genuinely innocent victims” is the proportion of young males among them. A very high proportion of young males is taken to indicate that many of the fatalities likely resulted from confrontations that the victims could have avoided. Graph 2.27 shows that for the first three phases of the conflict, the proportion of Palestinian noncombatants killed by Israel who fit into this category was significantly higher than the proportion among Israelis – especially so during Phase 1, when 85% of the Palestinian noncombatants killed by Israel were males aged between 12 and 29. Since the beginning of the conflict, 63% of all Palestinian noncombatants killed by Israeli forces have been in this category; this compares with 26% of all Israeli noncombatants killed by Palestinians.
As noted above, Phase 4 appears to be less “intifada-like” than any previous phase of the conflict.
Graph 2.28 displays all Israeli fatalities by age, with combatants separated from noncombatants.
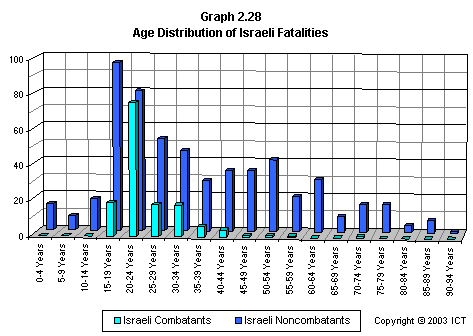
In addition to showing once more that the vast majority of Israelis killed have been noncombatants, this graph contrasts the very orderly distribution of Israeli combatant deaths – expected for a uniformed army with reserve service generally continuing until the mid-40’s – with a much broader distribution of noncombatant fatalities. (Note that the small number of Israeli combatants appearing in the “15-19 Years” category represents young conscripts, normally recruited at the age of 18. In fact, no Israeli 18-year-old combatants have been killed in the conflict so far; the youngest killed have been 19 years old.)
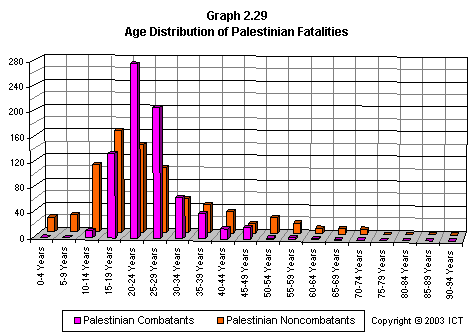
Graph 2.29, the equivalent graph for Palestinian fatalities, shows a completely different picture. Palestinian combatant fatalities, like those on the Israeli side, are concentrated in a narrow age range – although this concentration is slightly less pronounced. (This is unsurprising, given that Palestinian combatants are mostly members of unofficial terrorist/guerilla organizations.) Palestinian noncombatant fatalities, however, show an age distribution completely unlike that on the Israeli side. Instead of a “sloppy” distribution over a broad range of ages, Palestinian noncombatant fatalities are heavily concentrated among teenagers and young adults.
Graph 2.30 focuses specifically on noncombatants on both sides in their aged 45 and older.
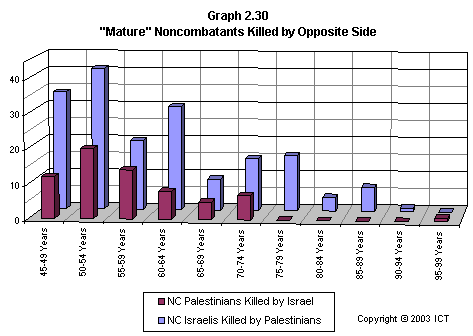
While overall Palestinian deaths outnumber Israeli deaths by almost three to one, Israeli “mature noncombatant” deaths are more than double the equivalent Palestinian fatalities. (If we omit Palestinian noncombatants, such as “collaborators”, killed by Palestinians, the ratio is 2.7 to1.)
Graph 2.31 shows a detailed breakdown of Israeli and Palestinian young noncombatants killed by the opposite side, by age and gender. These fatalities display a rather strange pattern. Among both Palestinians and Israelis, the number of young children (under the age of 10-11 years old) is comparatively small (although more young Israeli children were killed as a proportion of total fatalities). The number of Palestinian children killed begins to increase at about 10 years of age, and jumps up dramatically between the ages of 12 and 13. However, the increase consists entirely of boys – the number of Palestinian girls killed shows no age-trend, and is very low for all ages.
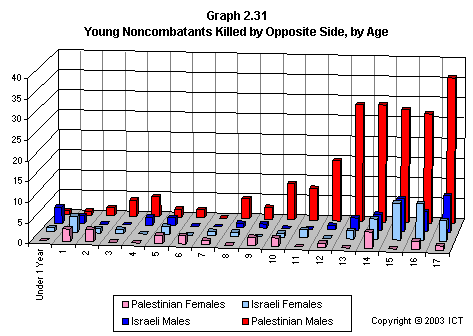
Young Israelis
killed by Palestinians show a different profile: Both
boys and girls show an increase starting at age 14 (perhaps a year
earlier
for boys), and just as many teenaged girls were killed as teenaged
boys.
What is significant in all these comparisons is, again, the contrast between the randomness of the pattern of Israeli fatalities and the more non-random distribution of Palestinian deaths. The random distribution is typical of terrorist attacks, which, though sometimes carried out in places frequented by young people, e.g. the Dolphinarium disco attack, may equally target restaurants or buses which are used by a wide spectrum of the population. Some of the most frequent targets of Palestinian terror attacks, such as open-air markets and public buses, are used disproportionately by the most vulnerable segments of society: women, the elderly, and the poor.
The fact that Palestinian deaths caused by Israeli actions do not, as a rule, follow the same pattern would seem to undermine claims that Israel deliberately targets Palestinian civilians.
NEW! We now also offer an up-to-date Israeli/Palestinian Conflict Statistics page with the latest totals from our database, as well as a full database query function for viewing "Intifada" incidents and casualty data. You can access all these features through ICT's Arab-Israeli Conflict Page.
Published: June 24,
2002
Updated: September 29,
2002
Source: International
Policy Institute for Counter-Terrorism
http://www.ict.org.il/articles/articledet.cfm?articleid=439
| This page was produced by Joseph E. Katz Middle Eastern Political and Religious History Analyst Brooklyn, New York Source:
Statistics appearing
in Haaretz Newspaper, IDF Website, Palestinian Information Service
Website,
and other public sources.
|
 SPECIAL
OFFER
SPECIAL
OFFER 
All Rights Reserved